The whiskers mark those values which are minimum and maximum unless these values exceed 1.5 * IQR. The IQR is the inter quartile range: the distance between Q1 and Q3. If there are observations which are outside 1.5 * IQR or even 3 * IQR then they are considered as mild and extreme outliers, respectively. -- http://informationandvisualization.de/blog/box-plot
Based on d3.js box plots example, this page calculates bayesian credible intervals for a discrete random variable collected from a pop-up user survey.
The coding and mathmatical logic of how to do this was explained to me in R by Zen on stats.stackexchange.com and I translated this to python and now to javascript.
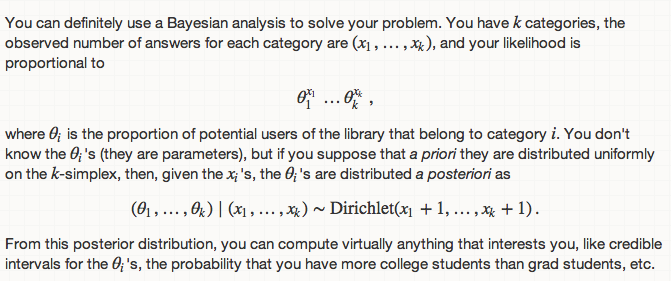
We want to know the proportion of our users who fit into each category, and we want to have some sense of how accurate our numbers are. We also want to know if/how these proportions change during different times of year. ...is this a problem where I can use Bayesian stats?
This uses https://github.com/jstat/jstat/ JavaScript Statistical Libraray to get random samples from the gamma distribution for calculating the dirichlet distribution.
A Data Driven Docuent http://d3js.org is used to display the box plots.